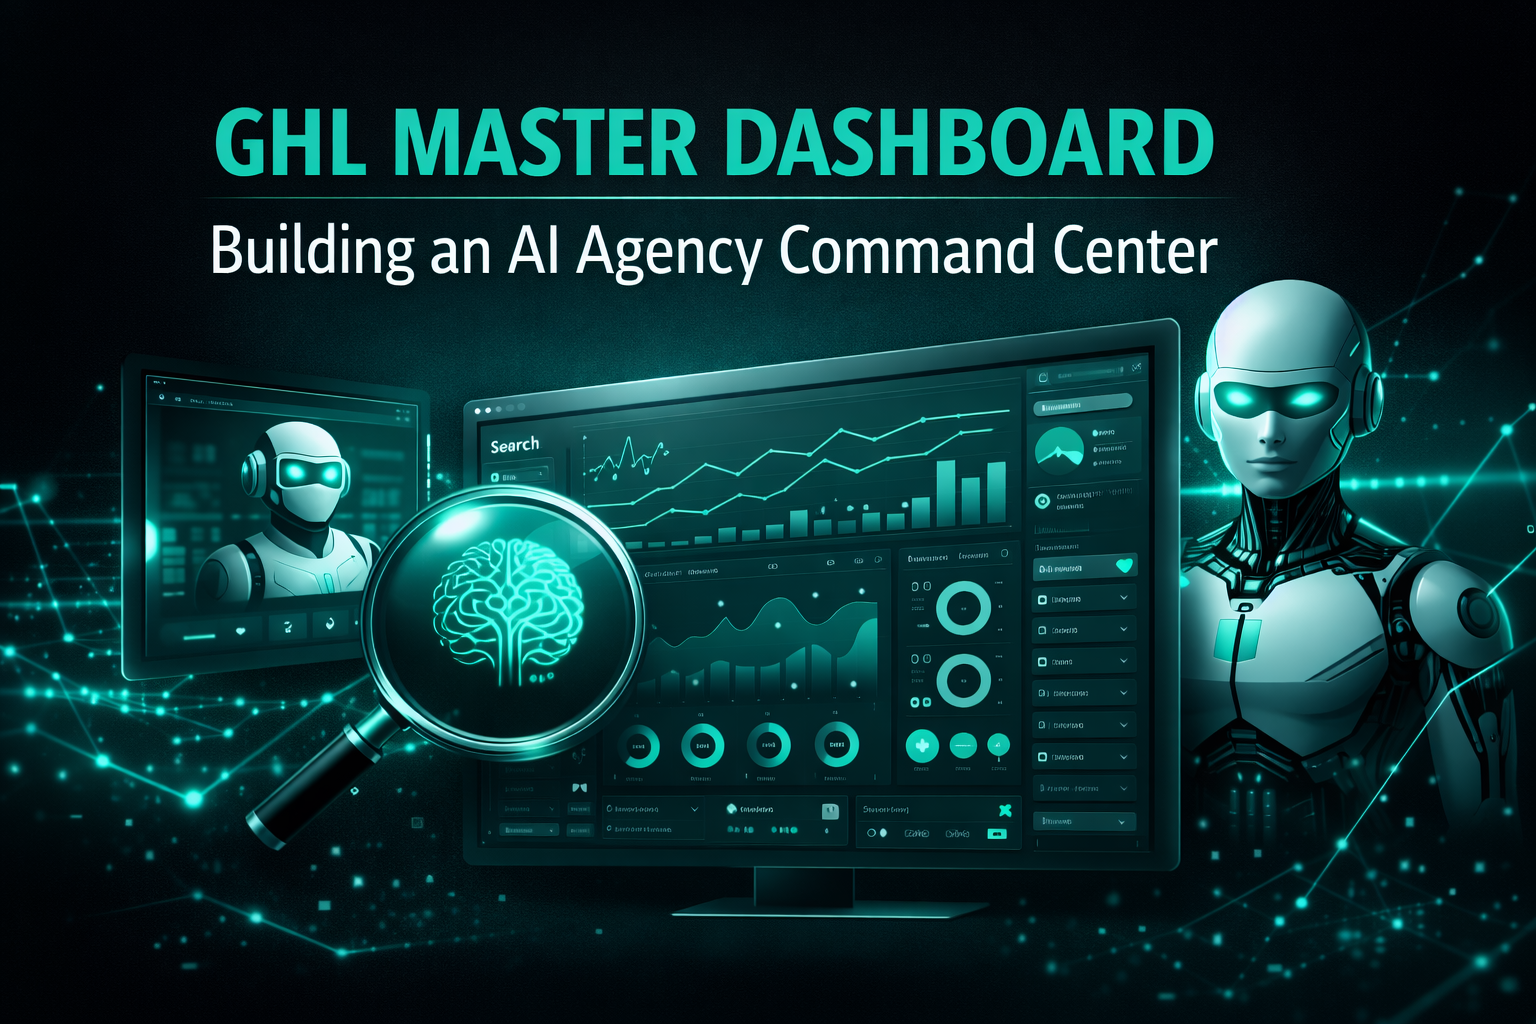
Building an AI-Powered Agency Master Dashboard (2026 Guide)
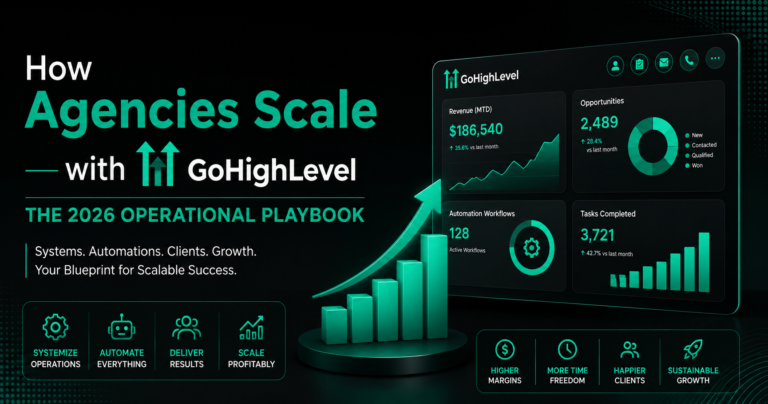
The final step in your GHL journey is the Master Dashboard. In 2026, you shouldn’t have to spend hours clicking through different client accounts to see how your agency is doing.
With the new AI-Powered Dashboards, GHL now tells you the “story” behind your numbers. It highlights where you are winning and warns you before a client is about to leave. This guide shows you how to build a Command Center that runs your entire agency.
What is a 2026 Master Dashboard?
A master dashboard is a single view that combines data from every sub-account you manage. It doesn’t just show “Leads”; it shows:
Read this: GHL Local SEO Automation: How to Rank Your Clients on Google Maps (2026)
The 5 Essential Widgets for Your Dashboard
In 2026, GHL allows you to build “Custom Widgets.” Here are the five you need:
The “Dashboard Summary AI”
This is the most powerful feature of 2026. Instead of reading a bar chart, you click one button: “Summarize with AI.”
Pipeline Value Heatmap
This widget shows you where the money is “stuck.” If you have $50,000 in the “Proposal Sent” stage but only $2,000 in “Won,” you know exactly where to focus your sales team.
Agentic Performance Tracker
Since you are likely using Conversation AI, this widget tracks “Bot vs. Human” performance.
Client Churn “Risk” Meter
Using Sentiment Analysis, GHL looks at the messages your clients are sending you. If a client is sending angry emails or asking about their contract, the widget turns Red. This allows you to call them before they cancel.
Multi-Channel Spend Analysis
This widget connects to Facebook, Google, TikTok, and LinkedIn. It shows a single “Total Spend” vs. “Total Revenue” line graph.
Comparison: Old Dashboards vs. 2026 AI Dashboards
| Feature | Old GHL Dashboards | 2026 AI Master Dashboards |
| Data View | Static Charts | Live, Interactive Widgets |
| Analysis | Manual (You do the math) | Automated (AI writes the summary) |
| External Data | GHL Data Only | Embeds PowerBI, Sheets, & Looker |
| Alerts | None | Triggers Slack alerts based on data |
| Branding | Limited | Full White-Label (Your Agency App) |
How to Set Up Your Master Dashboard (Step-by-Step)
Pro Tip: Using “Agent Studio” for Custom Reporting
In 2026, if GHL doesn’t have the exact widget you need, you can use Agent Studio. This tool allows you to build a custom “Reporting Agent.”
You can literally type: “Build me a widget that shows the average time it takes for a lead to move from ‘Form Submitted’ to ‘Paid Customer’ across my top 5 clients.” The Agent will build the logic for you.
Read this: GHL Multichannel Workflows: Reach Leads on SMS, Email, and WhatsApp (2026)
Frequently Asked Questions (FAQs)
Can I share this dashboard with my clients?
Yes. You can give clients a “View Only” link or embed the dashboard inside their own white-labeled portal.
Does the dashboard update in real-time?
Yes. Most widgets update every 60 seconds. Ad spend data typically syncs every 15-30 minutes.
Can I see my “Rebilling” profit?
Yes. There is a specific “Rebilling” tab that shows exactly how much profit you made from reselling SMS, Email, and AI credits.
Is it mobile-friendly?
Yes. The 2026 GHL Mobile App (v4.0) has a native “Dashboard View” that looks perfect on iPhone and Android.
Final Summary of the GHL Series
Over these 10 articles, we have covered everything from basic workflows to advanced AI Agentic Loops and Master Dashboards.
The successful agency of 2026 is no longer a “Marketing Agency”—it is a Software and Automation Partner. By using these tools, you provide a level of value that a human team alone could never achieve.